

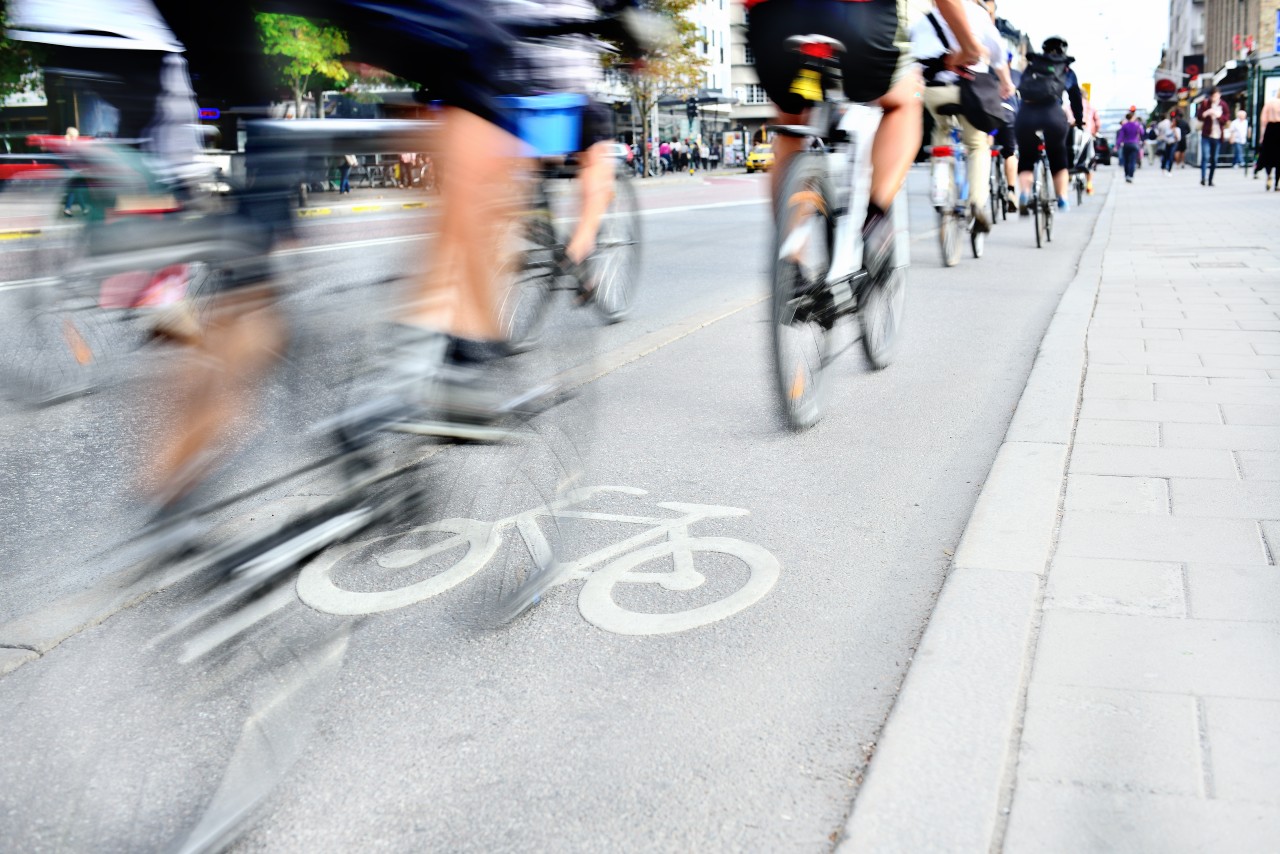
How cycle-friendly are UK cities?
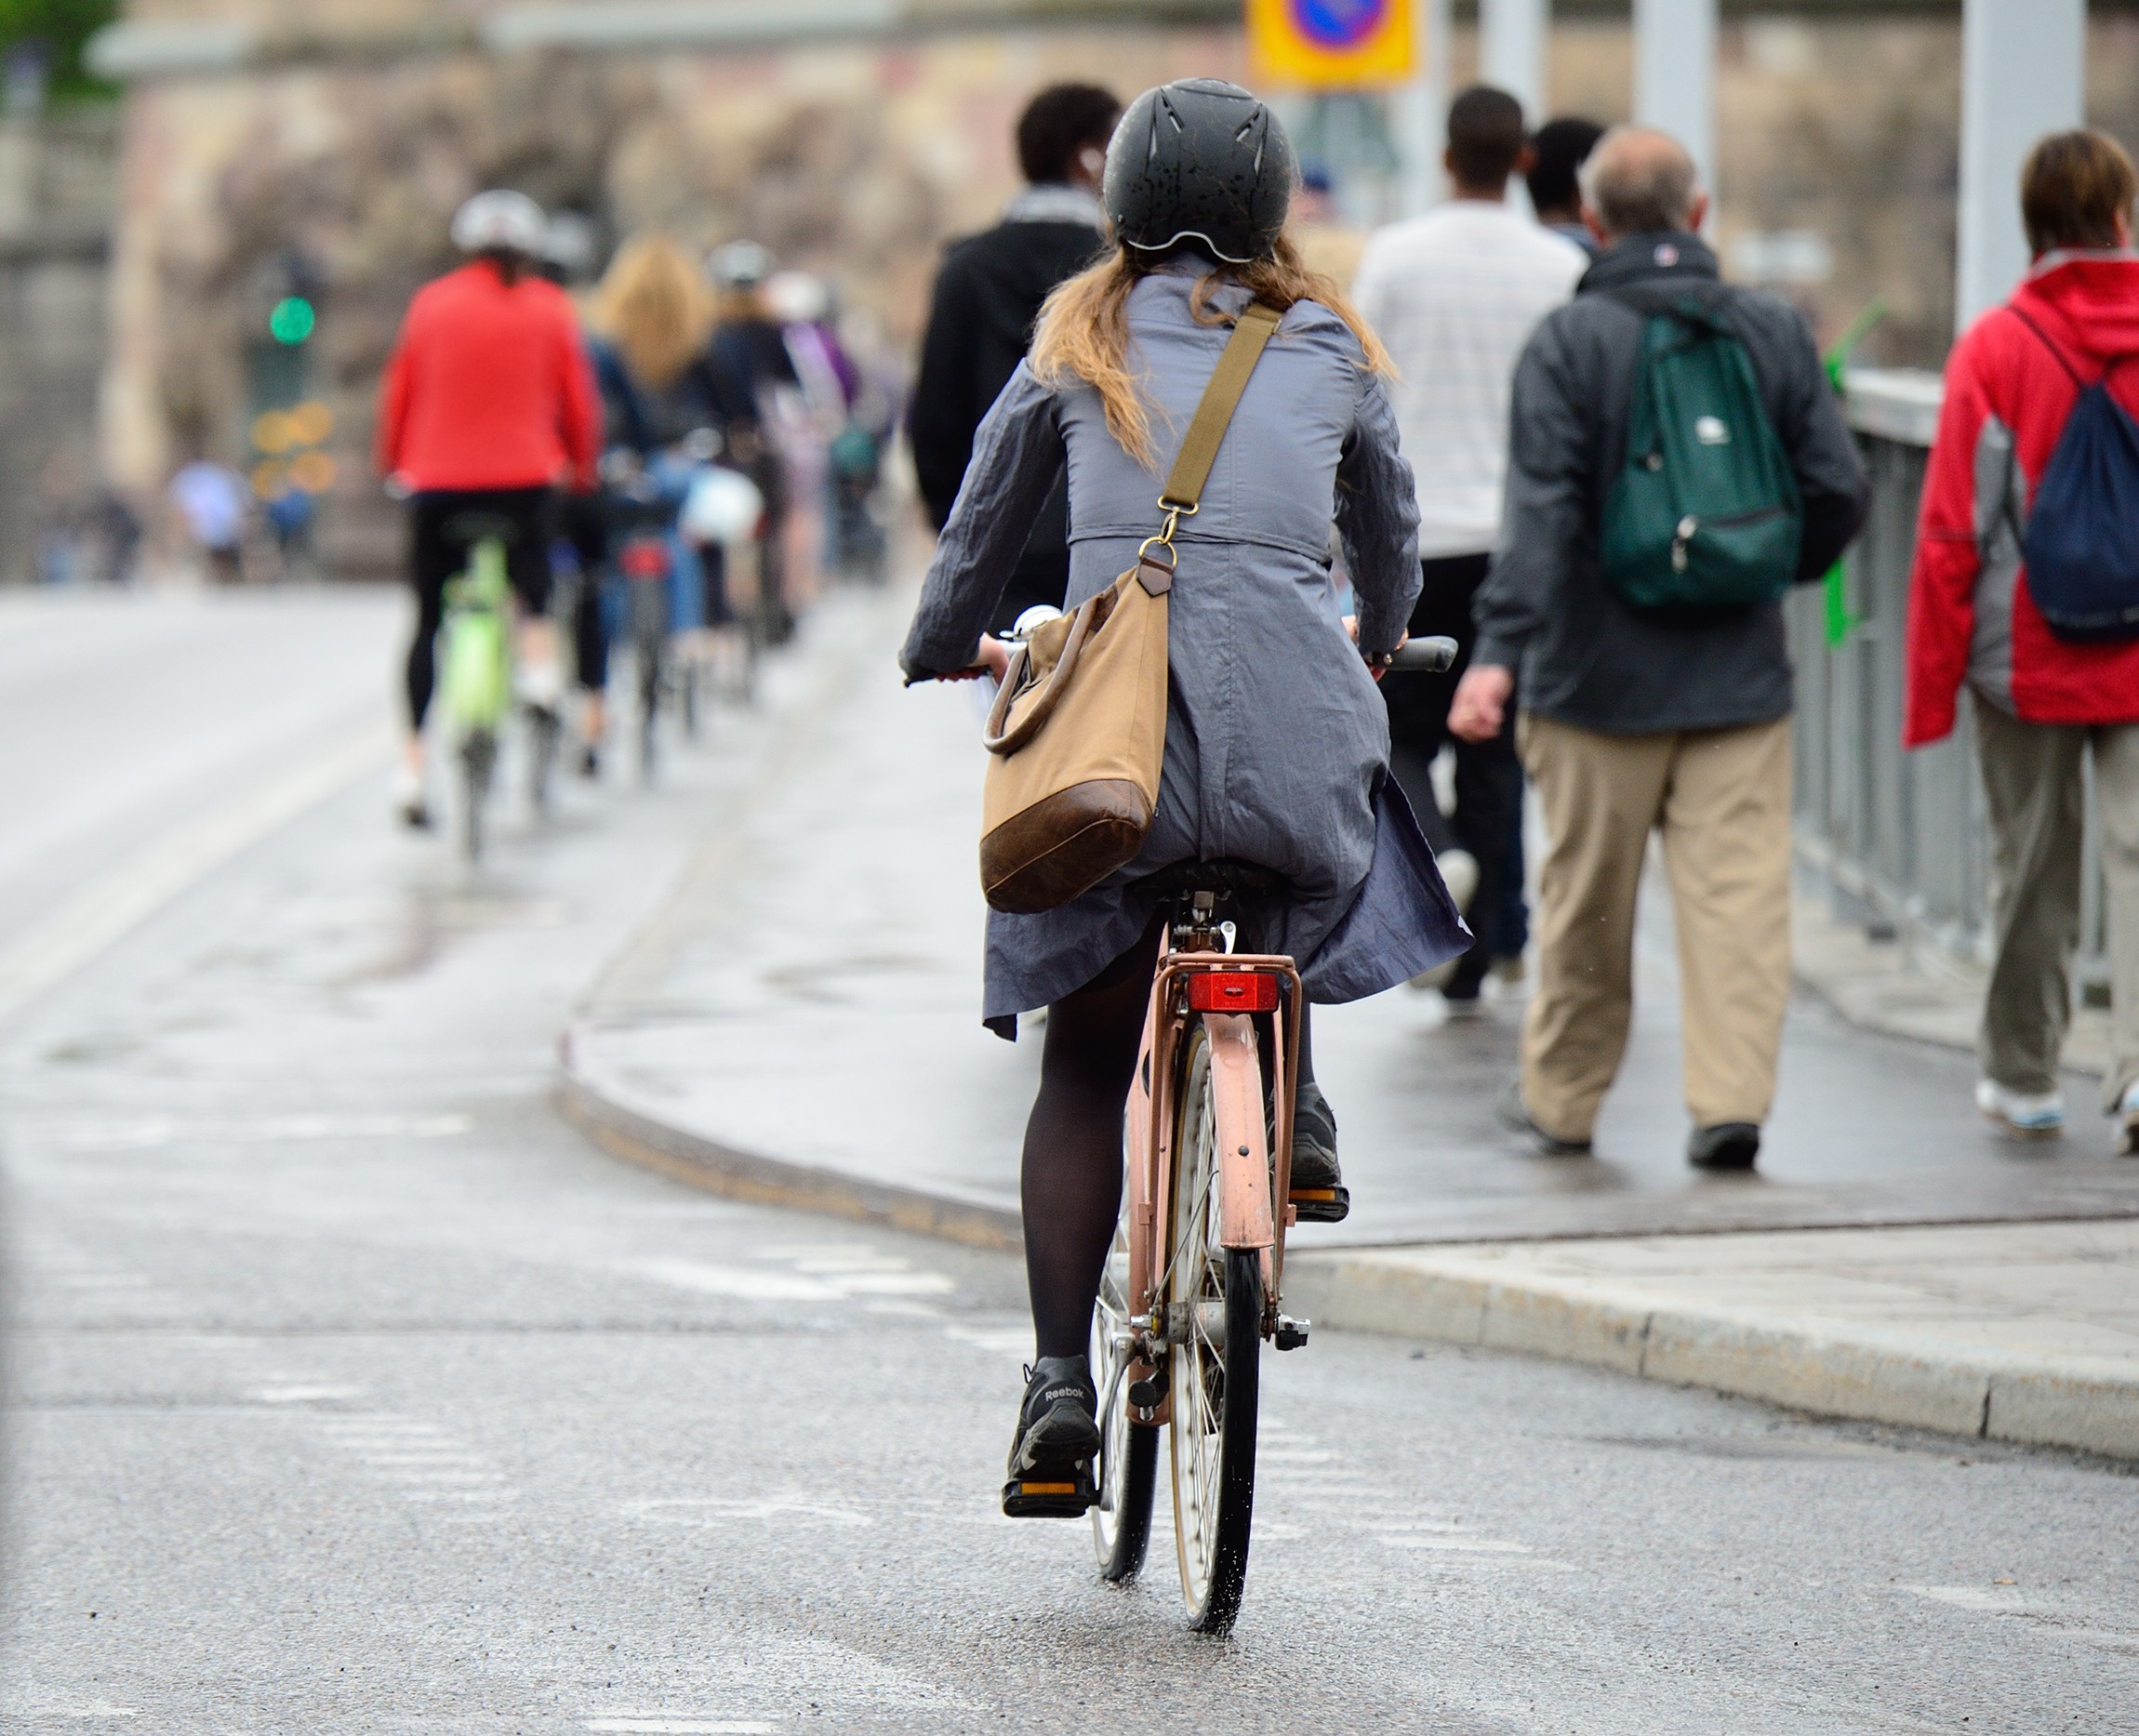
The Coronavirus pandemic changed life as we knew it across the world, but one of the more positive changes we saw was a renewed love of outdoor activities, with one activity in particular seeing a surge of popularity – cycling
Brits really embraced life on two wheels, and the number of bikes sold in the UK reached an estimated 3.3 million in 2020 according to Mintel*, an increase of 22% versus 2019 sales.
This figure alone paints a picture of a UK cycling ‘boom,’ so we decided to investigate this topic further.
What does the UK public think?
We wanted to find out how often UK adults' cycle, as well as how they view cycling infrastructure in the UK, so we decided to conduct a survey with 2,000 people, to assess the mood across the country.

One in ten Brits to start cycling
25-34 year-olds are the most likely to be frequent cyclers right now, with over half of millennials we surveyed (56%) reporting that they cycle regularly, with one in five of those (17%) picking up the hobby in the past year.
One in ten Brits (9%) revealed they have plans to start cycling regularly in 2022, a figure that equates to over 4.7 million people.
How did we determine our cycle-friendly capitals?
To discover where the UK’s most cycle-friendly cities are, we gathered cycle network and accident data from credible sources and then created a ranking system.
We ranked each city (inclusive of London boroughs) on:
- The total distance of mapped cycle ways versus the total road distance
- The total number of cycle routes in that place
- The number of road accidents involving cyclists versus the population
Each city was then given a score out of 100 (as a percentage) and we ordered these to reveal the places that topped the table.
You can see the links for all our source data at the end of this piece.
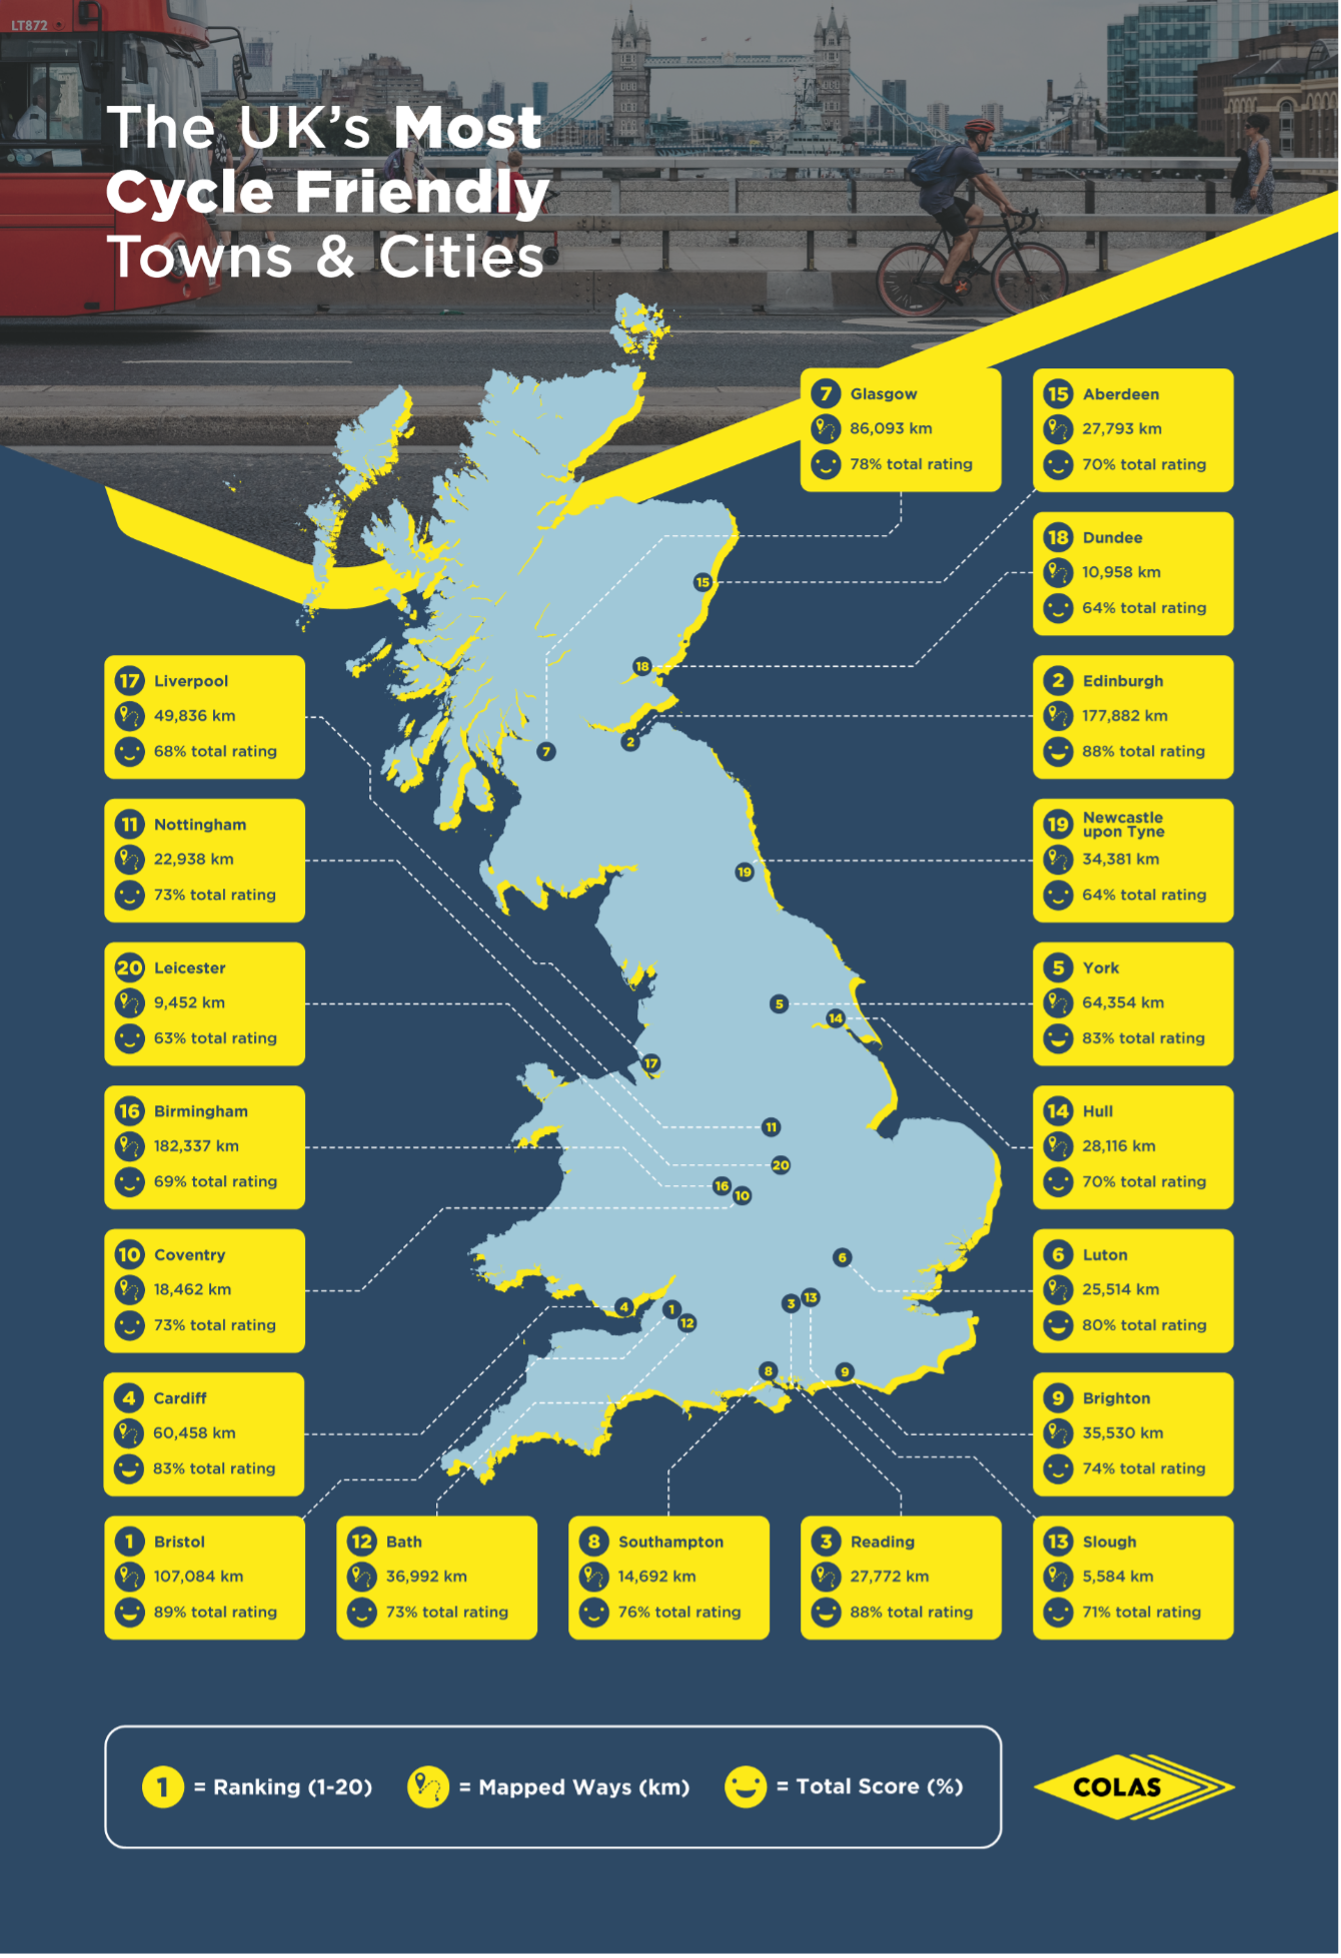
Where has the most mapped cycle ways in the UK?
Perhaps unsurprisingly, London is the UK city with the most mapped cycle ways – over 250,000km of them, to be precise. The UK’s second city, Birmingham, also takes second place in terms of cycle ways, with Edinburgh, Bristol and Carlisle completing the top five.
UK cities with the most mapped cycle ways
- London (269,693 km)
- Birmingham (182,337 km)
- Edinburgh (177,882 km)
- Bristol (107,084 km)
- Carlisle (103,451 km)
Barnsley appears to currently have the least mapped cycle ways, with just 766km across the entire city. Rochford (1171km) and Rotherham (1269km) also featured at the bottom of our table, suggesting there is room for development in the coming years.
UK cities with the least mapped cycle ways
- Barnsley (766 km)
- Rochford (1171 km)
- Rotherham (1269 km)
Data collected via a freedom of information request with councils also revealed cities that have a high percentage of cycle lanes, and also places where the total distance of cycle lanes is particularly high:
UK cities with a high percentage of cycle lanes (considering the total road network)
- Milton Keynes (16%)
- City of Westminster, London (11%)
- Camden, London (9%)
- Slough (6.5%)
- Brighton (6.4%)
- Aberdeen (4.6%)
- Edinburgh (4%)
- Luton (2%)
UK cities with a large distance in cycle lanes
- Nottingham (482 km)
- Edinburgh (311 km)
- Milton Keynes (216 km)
- Newcastle upon Tyne (150 km)
- Slough (136 km)
- Swansea (118 km)
- Sheffield (112 km)
- Luton (69 km)
Which cities have invested the most in their cycle networks?
We also investigated how much money each UK city had invested into their cycle network over the past couple of years, by requesting figures from councils via a freedom of information requests.
How much UK cities have invested in improving their cycle network in the last two years:
- City of Westminster, London (£7,998,900)
- Wigan (£7,420,000)
- Swansea (£7,335,100)
- Manchester (£7,275,532)
- Camden, London (£7,028,792)
- Plymouth (£6,086,274)
- Nottingham (£6,003,906)
- Liverpool (£5,924,410)
- Dundee (£5,181,200)
As may be expected, central London has seen significant investment in cycle network improvements since the start of 2020, but councils in Wigan, Swansea, Manchester, Plymouth, Nottingham, Liverpool and Dundee also revealed to us that they have been working hard to improve their active travel infrastructures.
What these cities are spending?
The FOI data from Edinburgh Council revealed that they have spent more than £5.87 million on improvements to their cycle network in the last two years (data covers up to Q3 2021) and that they plan to spend another £69 million on work before the end of 2024. Currently, 4% of roads in the Scottish capital city feature cycle lanes, and there are already 311 km of cycle-ready roads too.
Just hitting our current top 20 of the most cycle-friendly cities, the FOI data from Plymouth City Council revealed that they plan to invest £59 million in their cycle infrastructure across the next two years, having already made investments of more than £6 million – suggesting that Plymouth could quickly leap up the table.
Millions are already being invested
The FOI findings also highlighted that Nottingham City Council have also made large cycling-focused investments over the past two years (spending £6 million), with plans to invest almost five times that amount in the coming two years (£30 million).
Newport in Wales currently sits outside the top 20 in our cycle-friendly cities table, but the council has invested over £4 million in improvements in recent years, and they are planning to spend a further £750,000 on additional work in 2022 work, so their position is expected to rise in the coming years too.
How has Colas been involved in improving cycle networks across the UK?
We are proud that Colas Ltd has worked with several councils to improve their city’s cycle friendliness, not least the current Leeds Superhighway Cycle Route that is set to improve cyclability in one of the biggest cities in the UK.
The trailblazing CYCLOPS junction project will also improve cycling friendliness in the UK, with the scheme making up part of the Bee Network, which will form the UK’s largest joined up cycling and walking network, covering 1,800 miles. The junction in Hulme, Manchester, fully segregates cyclists from general traffic and it is currently the first of its type in the UK, but more are set to follow.
So, what are the key takeaways?
There are some areas of the UK where infrastructure changes to become more cycle-friendly are likely to be very well received, and new projects like the aforementioned Colas projects in Leeds and Manchester are examples of civil engineering activity that can really improve the situation in the coming years.
We believe that easy and accessible cycle networks and active travel infrastructure in general are key to the UK’s goal to reduce its carbon footprint, and figures showing that more of the country is embracing life on two wheels (or two feet) in greater numbers can only be a good thing.
The data sources for our study
We ran a survey with 2,000 UK adults in September 2021. The cycle-friendly rankings were created using the following information, collated in October and November 2021:
- Data on the number of cycle lanes, kms of cycle lanes and the population size from BikeMap.net
- Data on reported road casualties by road users type and severity, Great Britain 2010-20 sourced from Department for Transport in October 2021
- Data on accidents involving cyclists per city sourced from CrashMap, utilising Department for Transport data, in October 2021
- Data on reported accidents involving pedal cyclists, by local authority, Great Britain 2020 sourced from Department for Transport in October 2021
- A freedom of information request was sent to UK councils, asking them to share details about their current cycle networks, improvements made (and investment) in the last five years, and improvements planned (and anticipated investment) in the next five years.
